
CASE STUDY
What began as embedded KPI reporting evolved into a standard for analytics across platforms. I partnered with engineering to define core metrics and built a unified telemetry system using Power BI Embedded. This created consistency in how data is structured, visualized, and consumed.
The result established a shared analytics foundation across business units, with embedded KPIs in Cloud Control and scalable reporting across platforms.
Analytics existed —
but they were inconsistent and difficult to trust.
Each domain defined and displayed metrics differently.
Reporting was fragmented across dashboards.
There was no unified way to understand performance or trends.
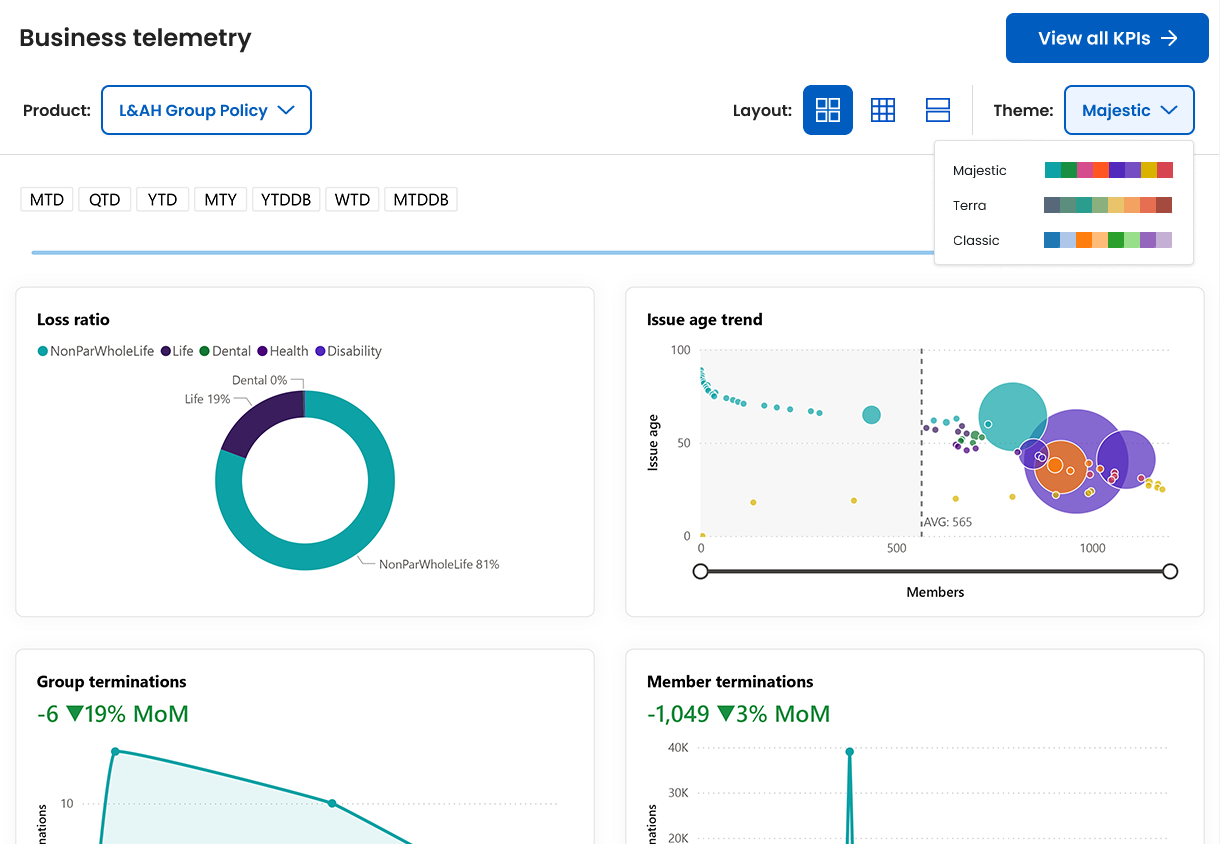
The initial focus was on surfacing key performance indicators within Cloud Control.
These KPIs needed to provide immediate visibility into business and operational health, while remaining simple and easy to scan.
Early exploration centered on:
This established the foundation for how users interpret system health and performance.
To ensure accuracy and consistency, I worked directly with engineering to define the underlying measures powering the dashboards.
This included translating business questions into measurable signals and aligning on consistent definitions across domains.
Many of the core metrics were developed through this collaboration, ensuring both technical accuracy and business relevance.
KPIs were embedded directly into Cloud Control to provide a centralized view of performance.
The focus was on clarity and immediate interpretation:
This transformed Cloud Control from a monitoring surface into a decision-support layer.
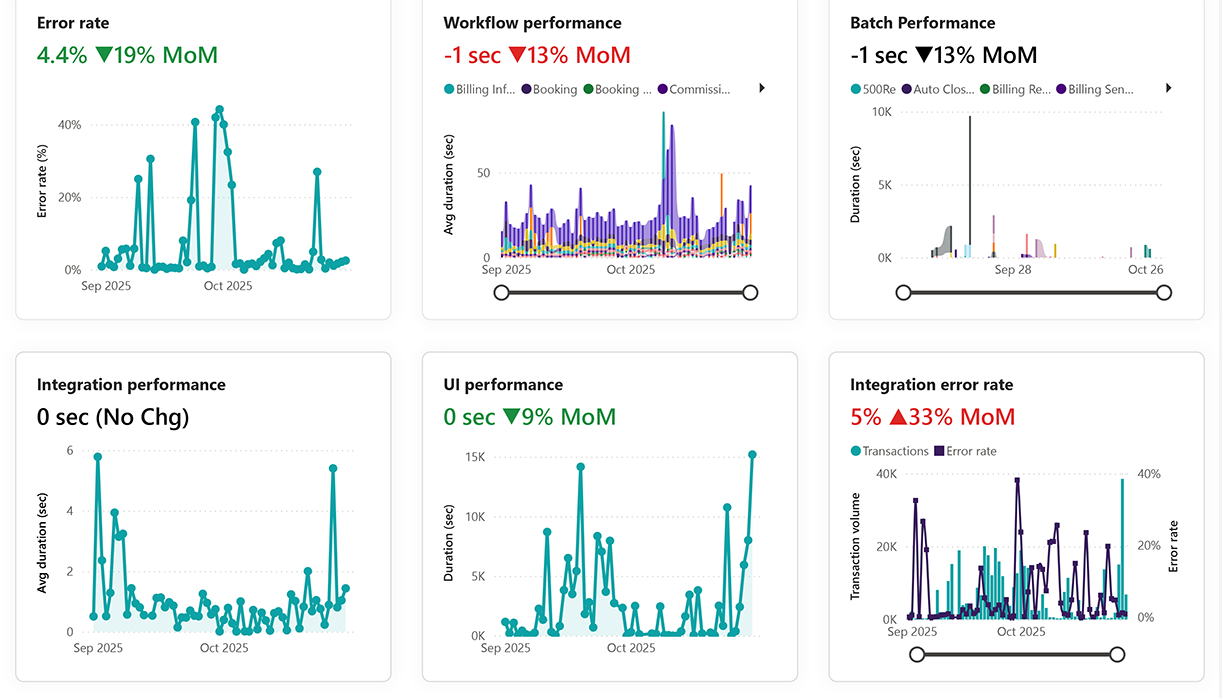
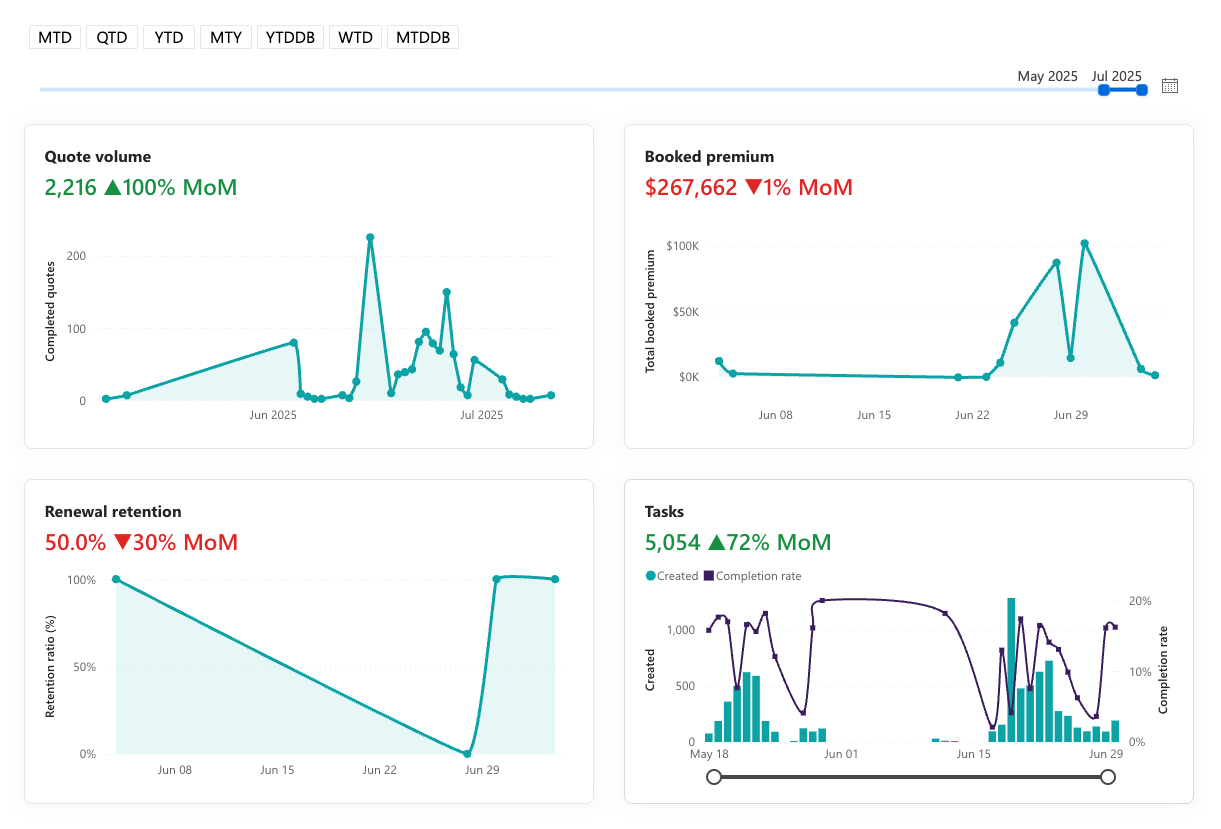
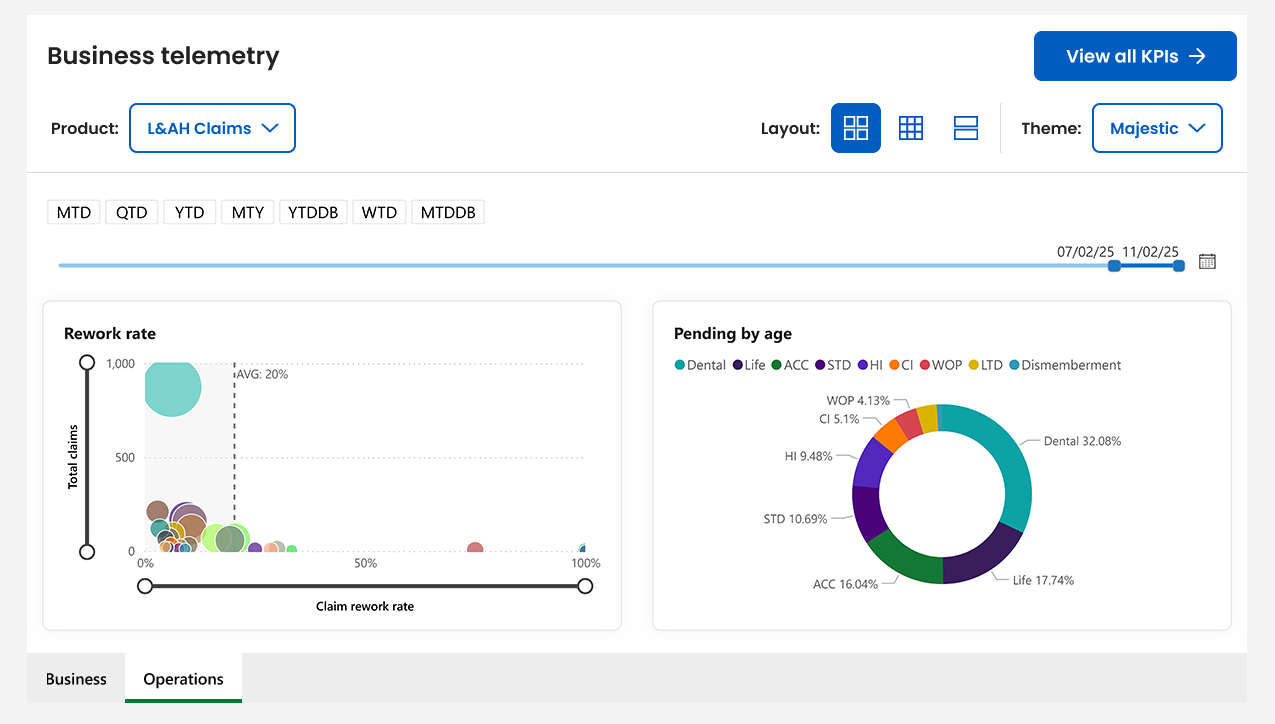
As the system matured, the scope expanded beyond summary KPIs into detailed reporting across domains.
This included line-of-business and operational reports such as:
These reports extended visibility beyond high level metrics, enabling teams to understand workflows, diagnose issues, and monitor operational health.
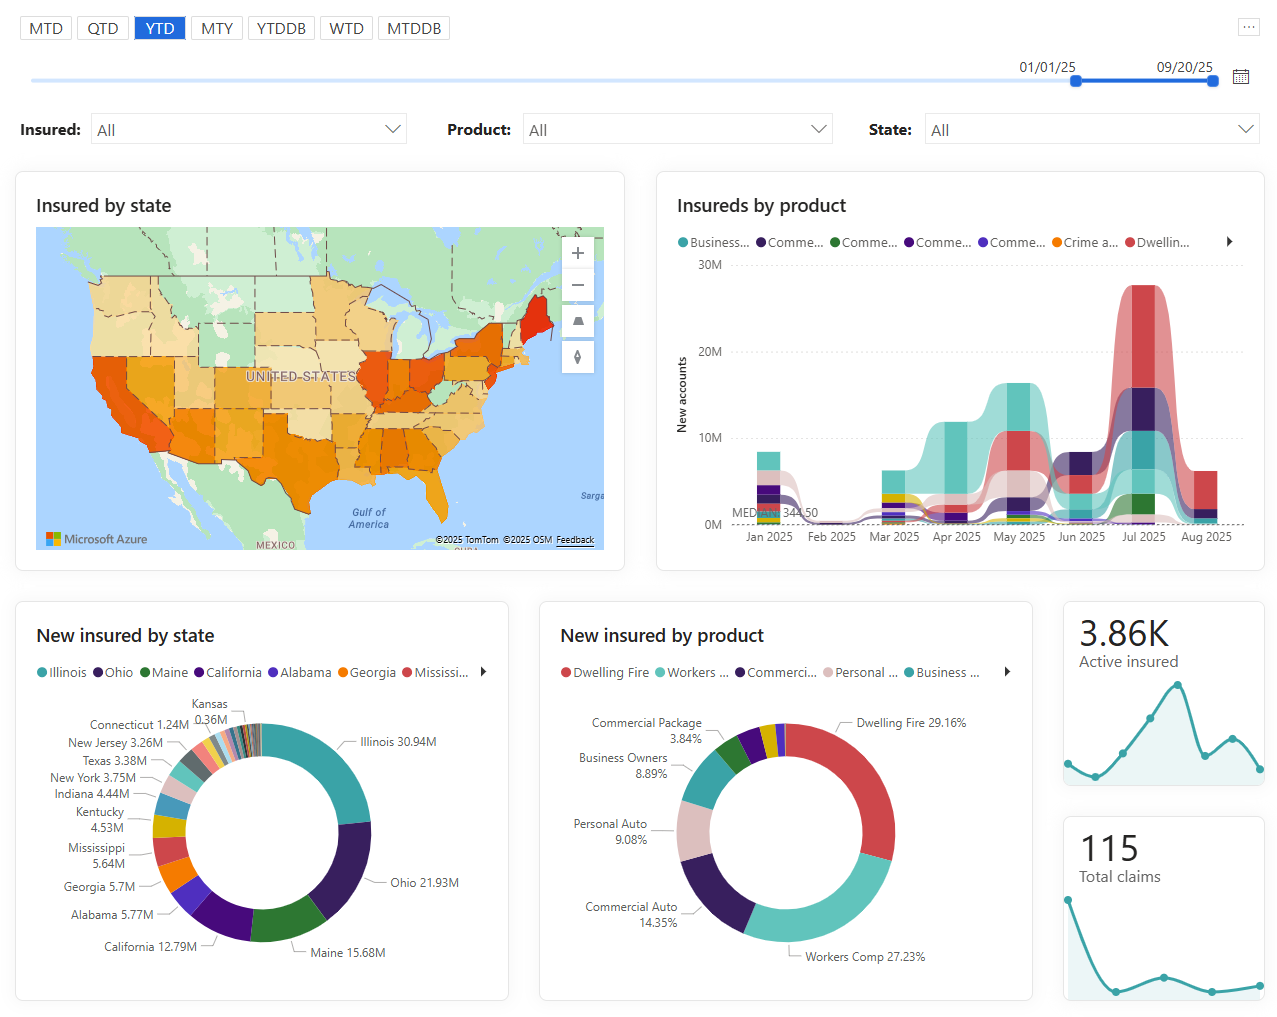
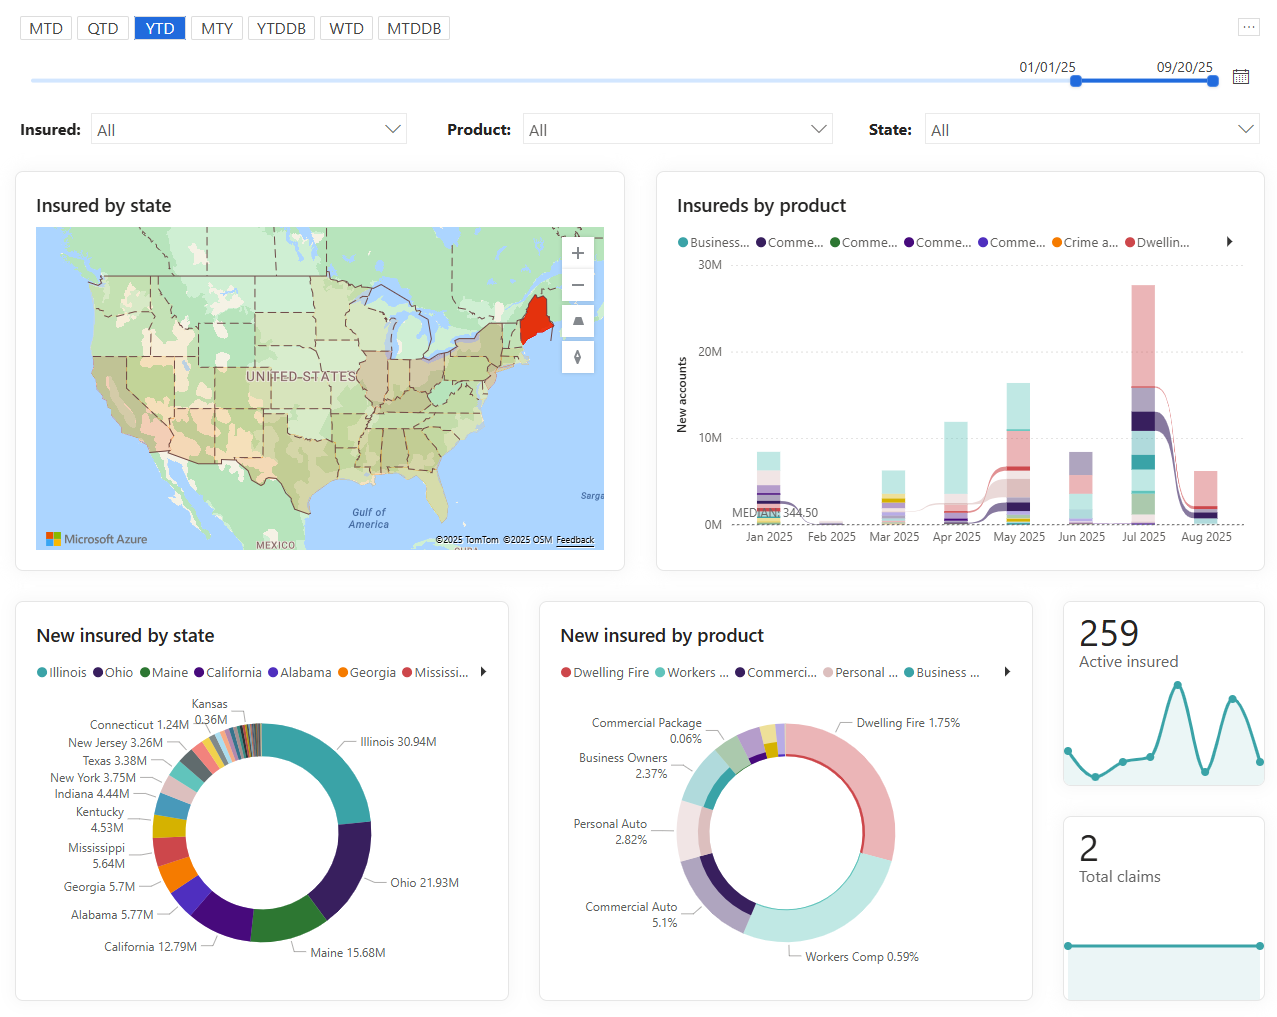
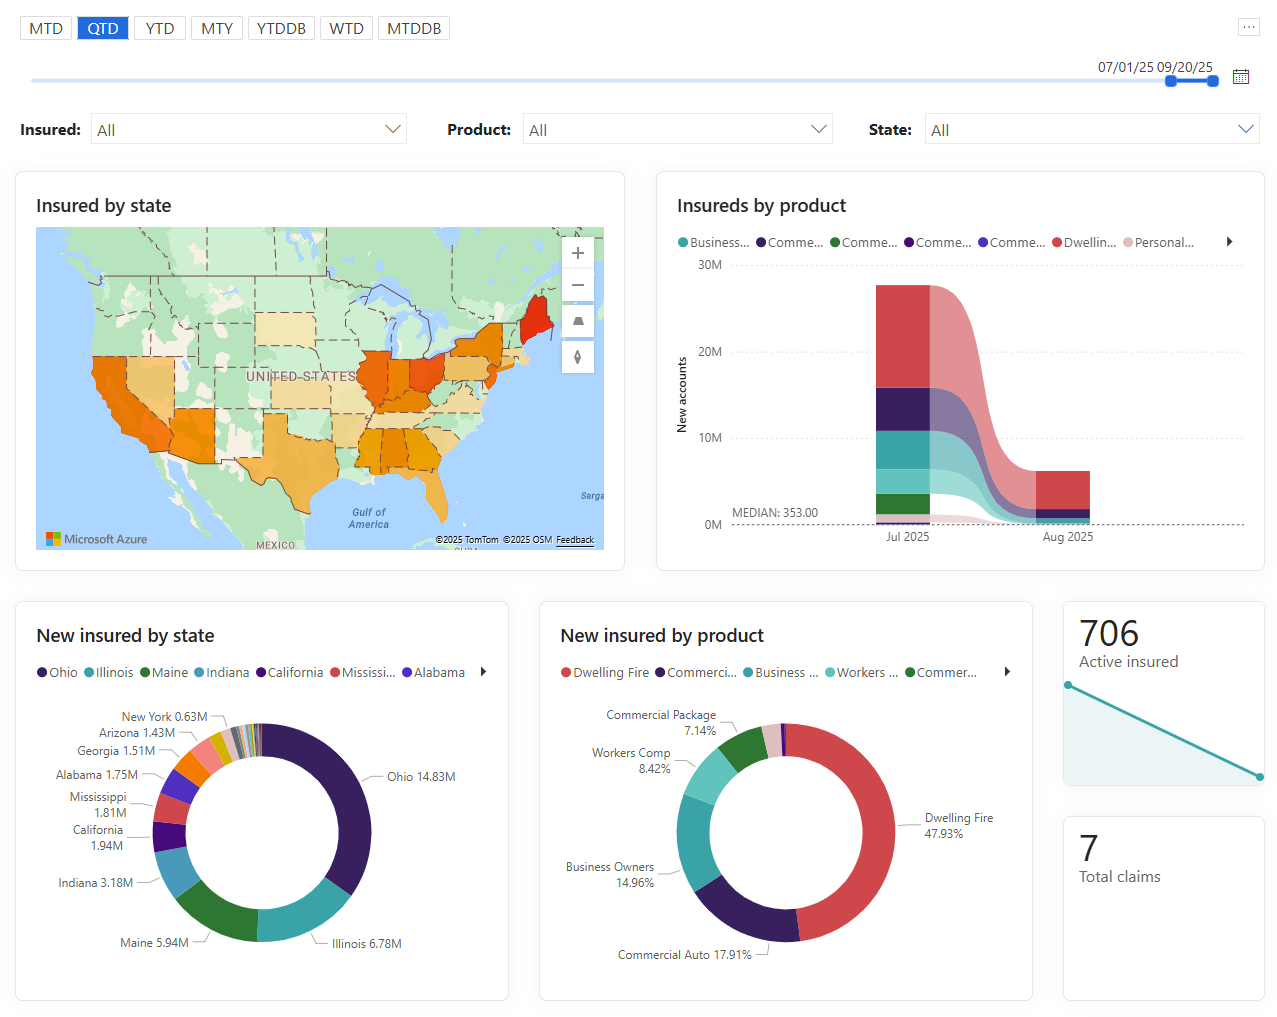
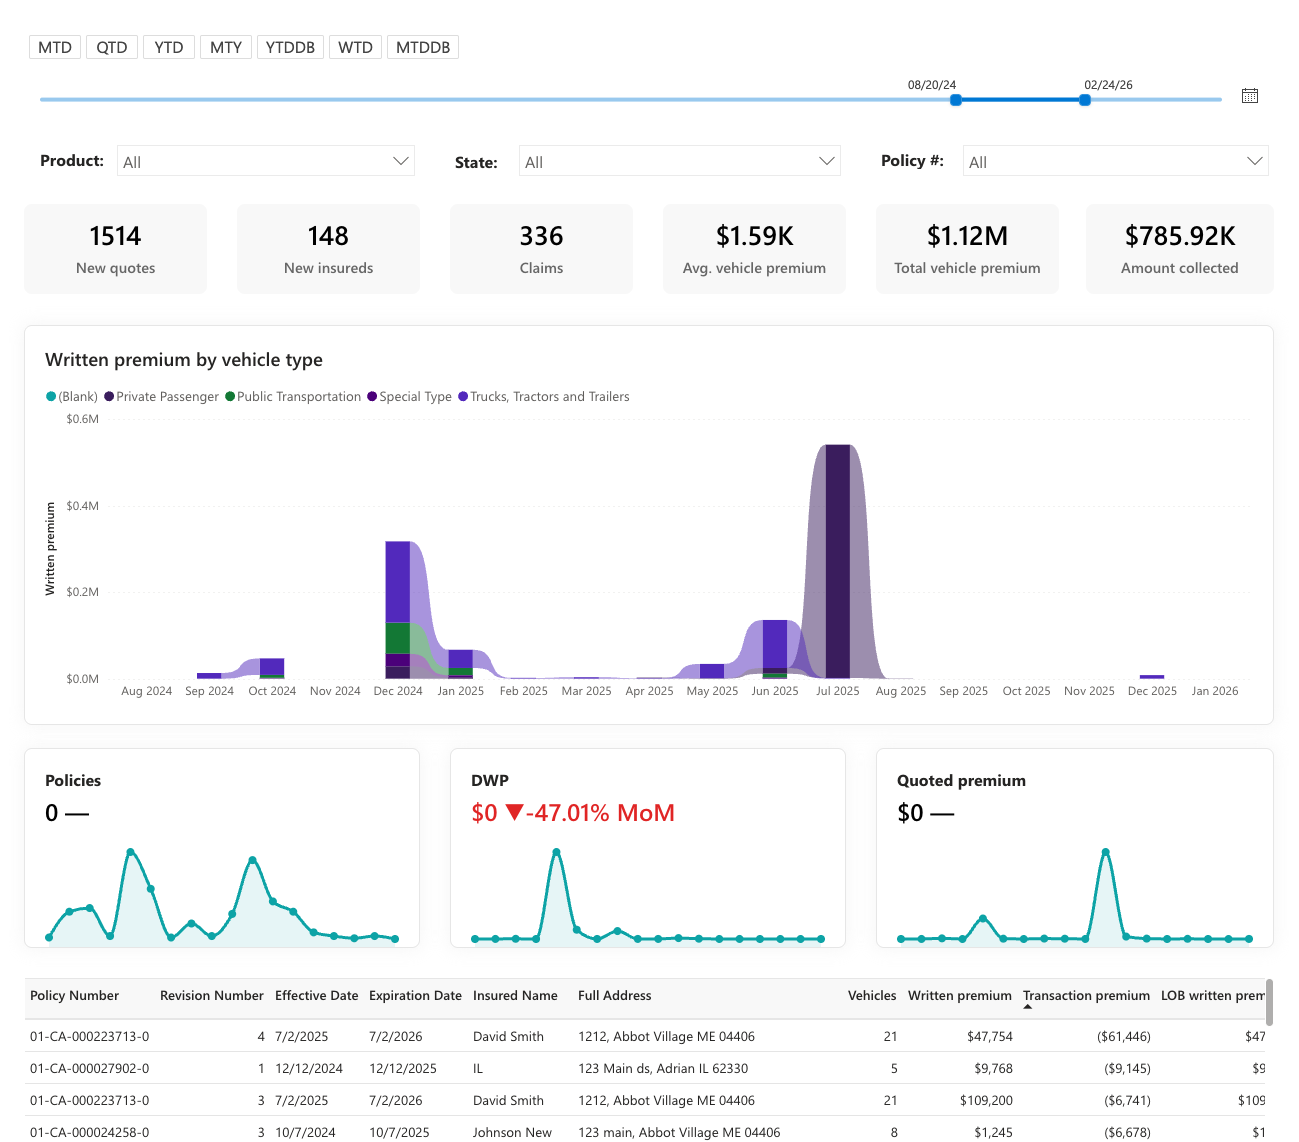
As reporting expanded across domains, consistency became critical.
A shared structure was established across all dashboards to ensure metrics were interpreted consistently and reports remained easy to scan and compare.
Each report followed a common pattern:
This created a predictable and repeatable analytics experience across platforms.
The system was adopted across multiple business units and platforms.
Power BI Embedded became the standard for analytics, with shared patterns enabling teams to build and extend reporting consistently.
I led enablement efforts to support adoption:
What began as a KPI initiative evolved into a shared analytics standard across the organization.

The telemetry system established a consistent analytics foundation across the organization, enabling teams to understand performance, act on insights, and scale reporting across platforms.
Established as the standard for analytics across business units
Embedded KPIs in Cloud Control with reporting across multiple platforms
Standardized structure for metrics, visualization, and interaction
Enabled teams to monitor workflows, diagnose issues with confidence
Lead Product Designer, expanded into Power BI admin and analytics lead
End to end design of embedded KPI dashboards and operational reporting, including metric definition and DAX development
Led design in collaboration with cross functional data and engineering teams across business units
MVP released Fall 2025, followed by continued expansion across domains and platforms