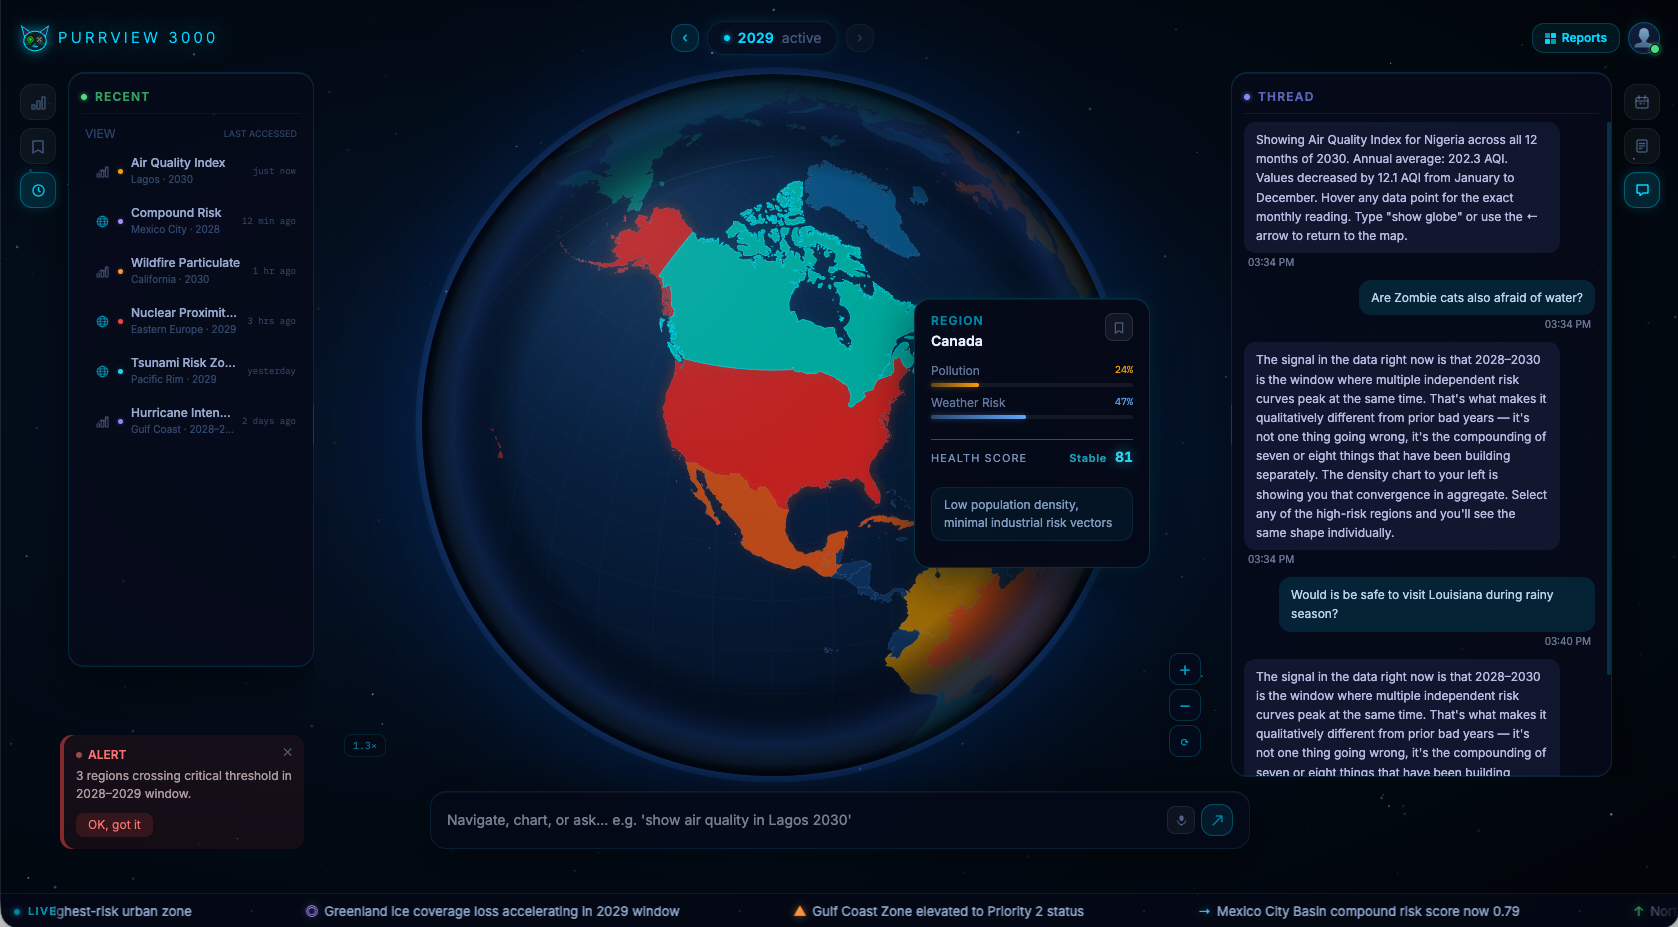
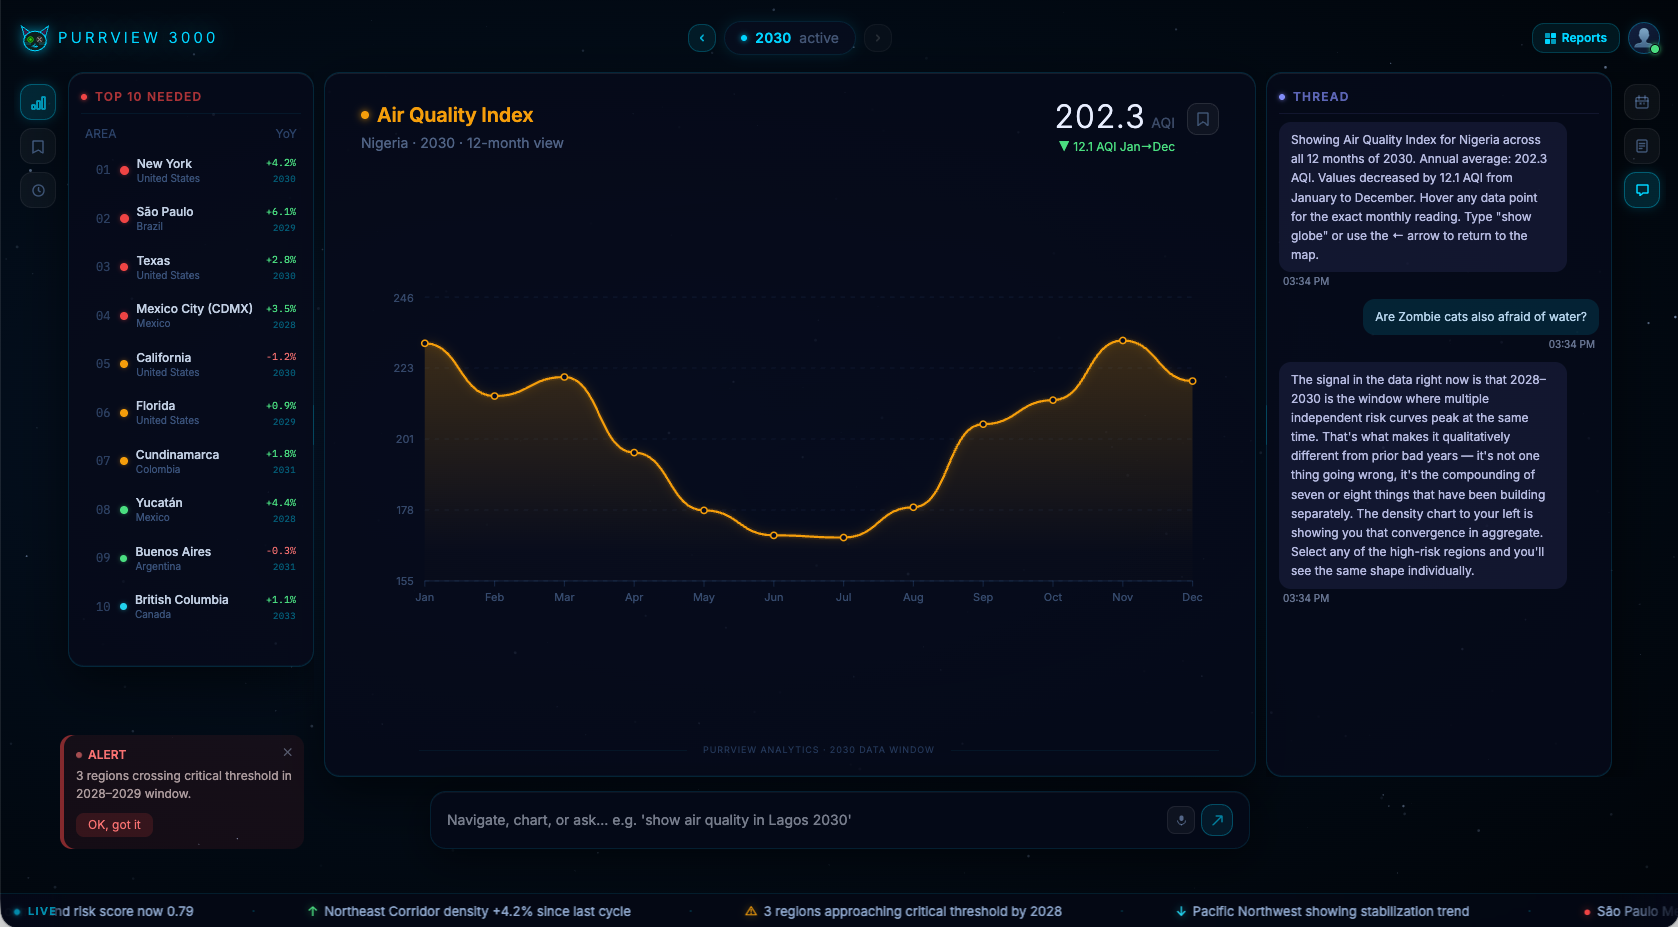
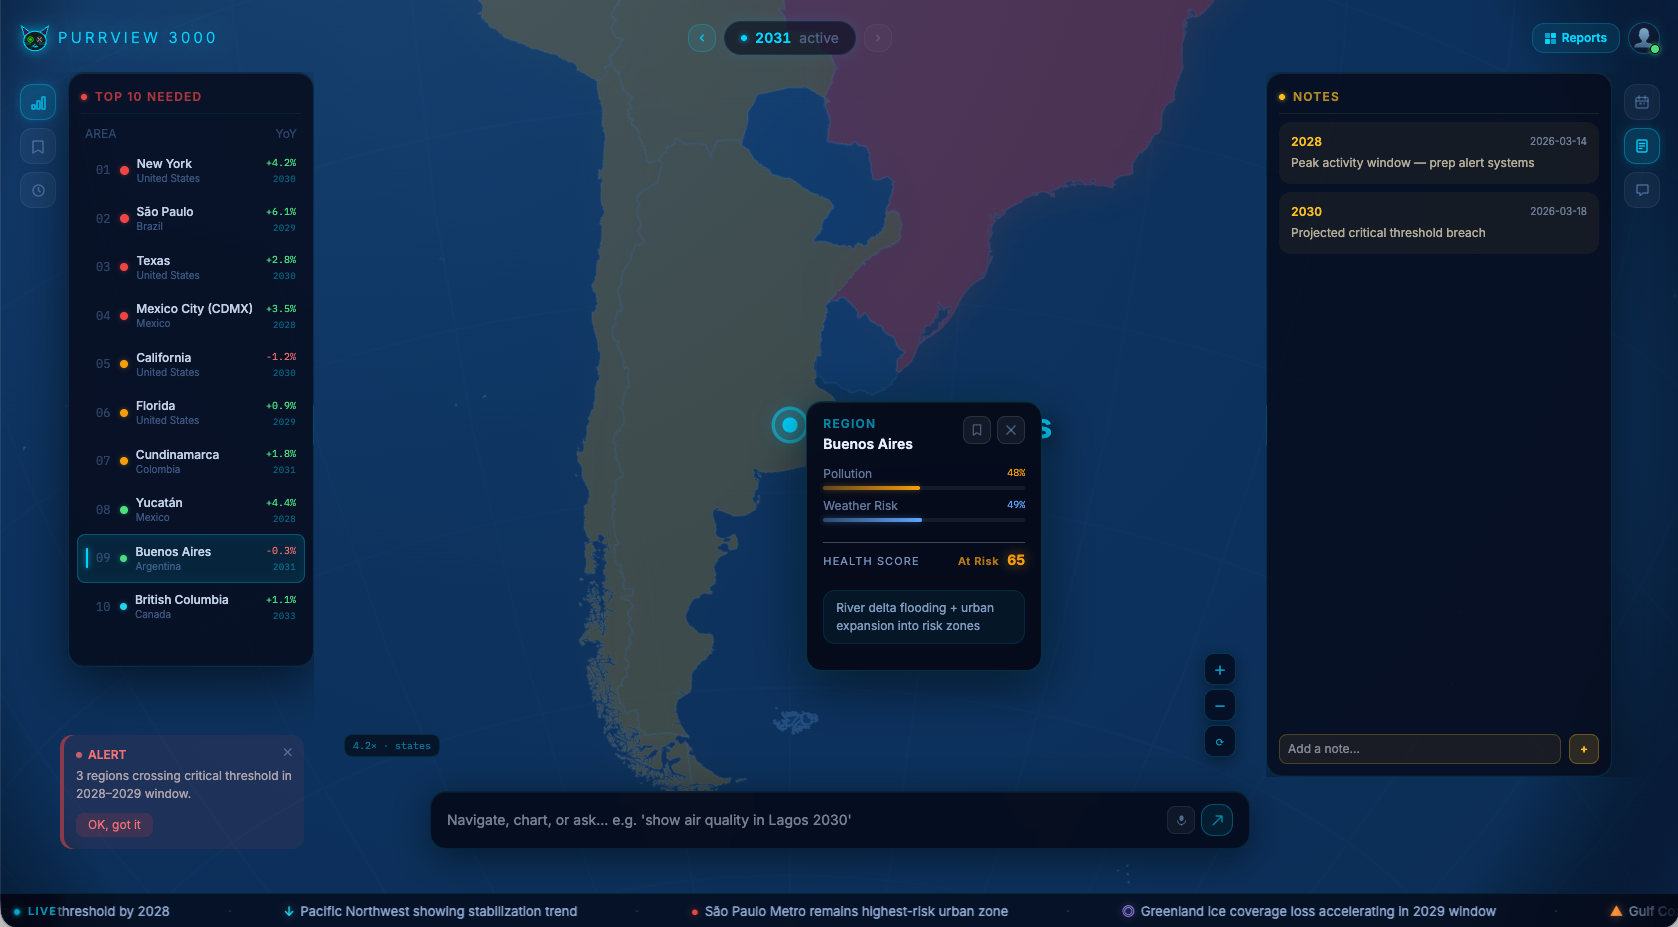
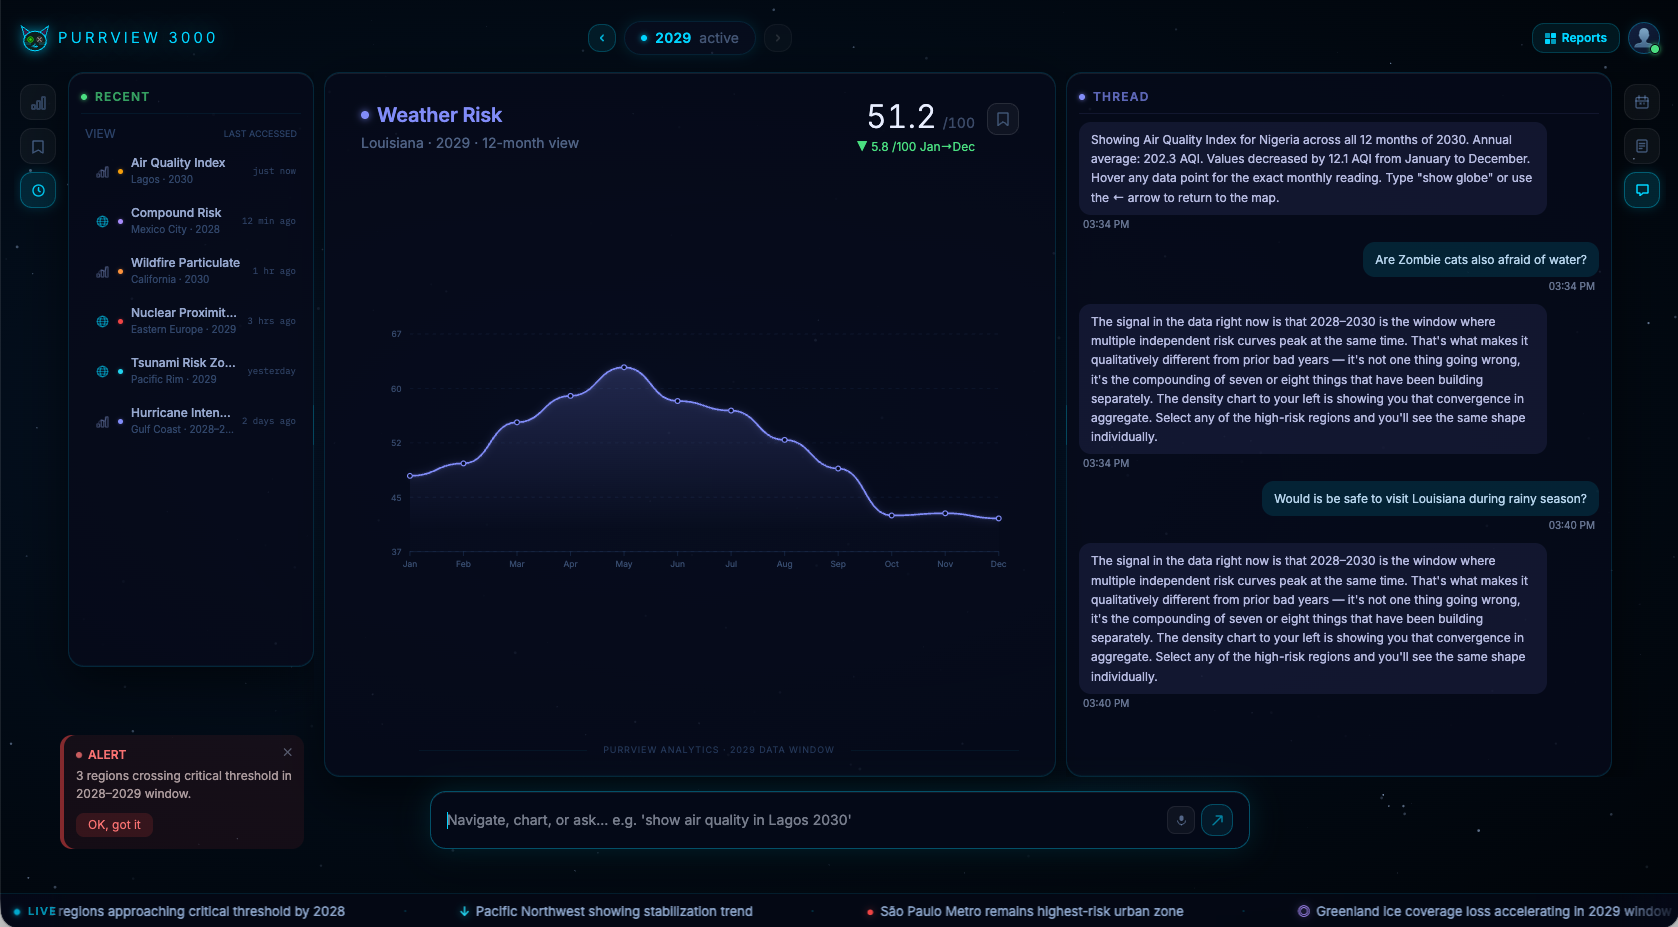
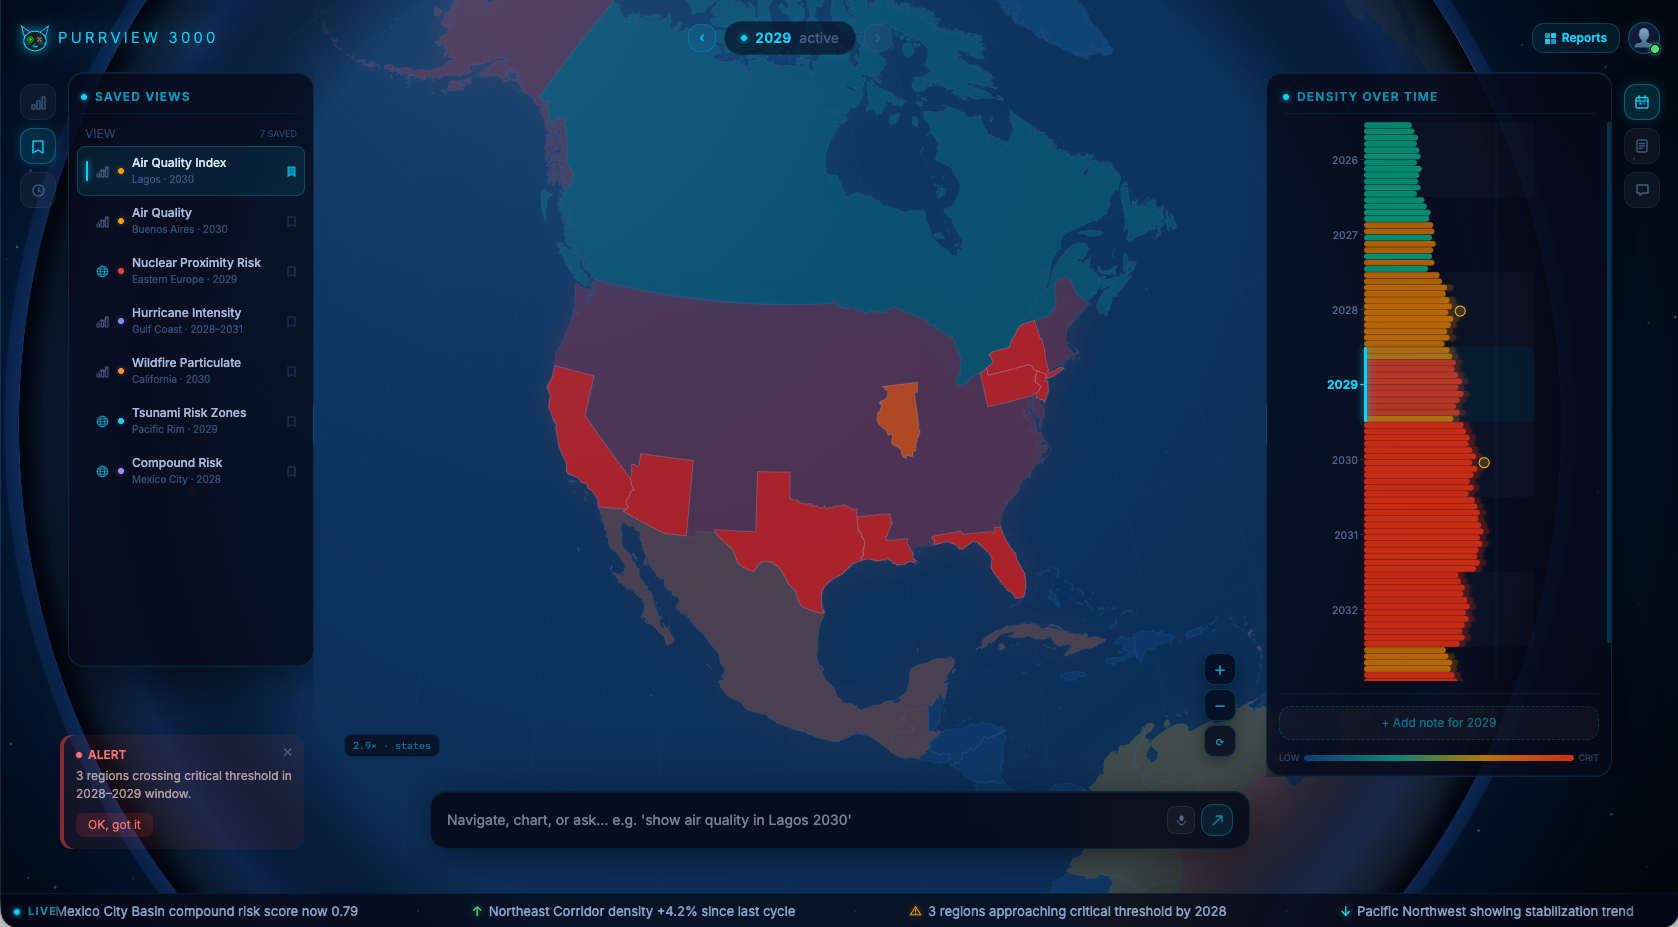
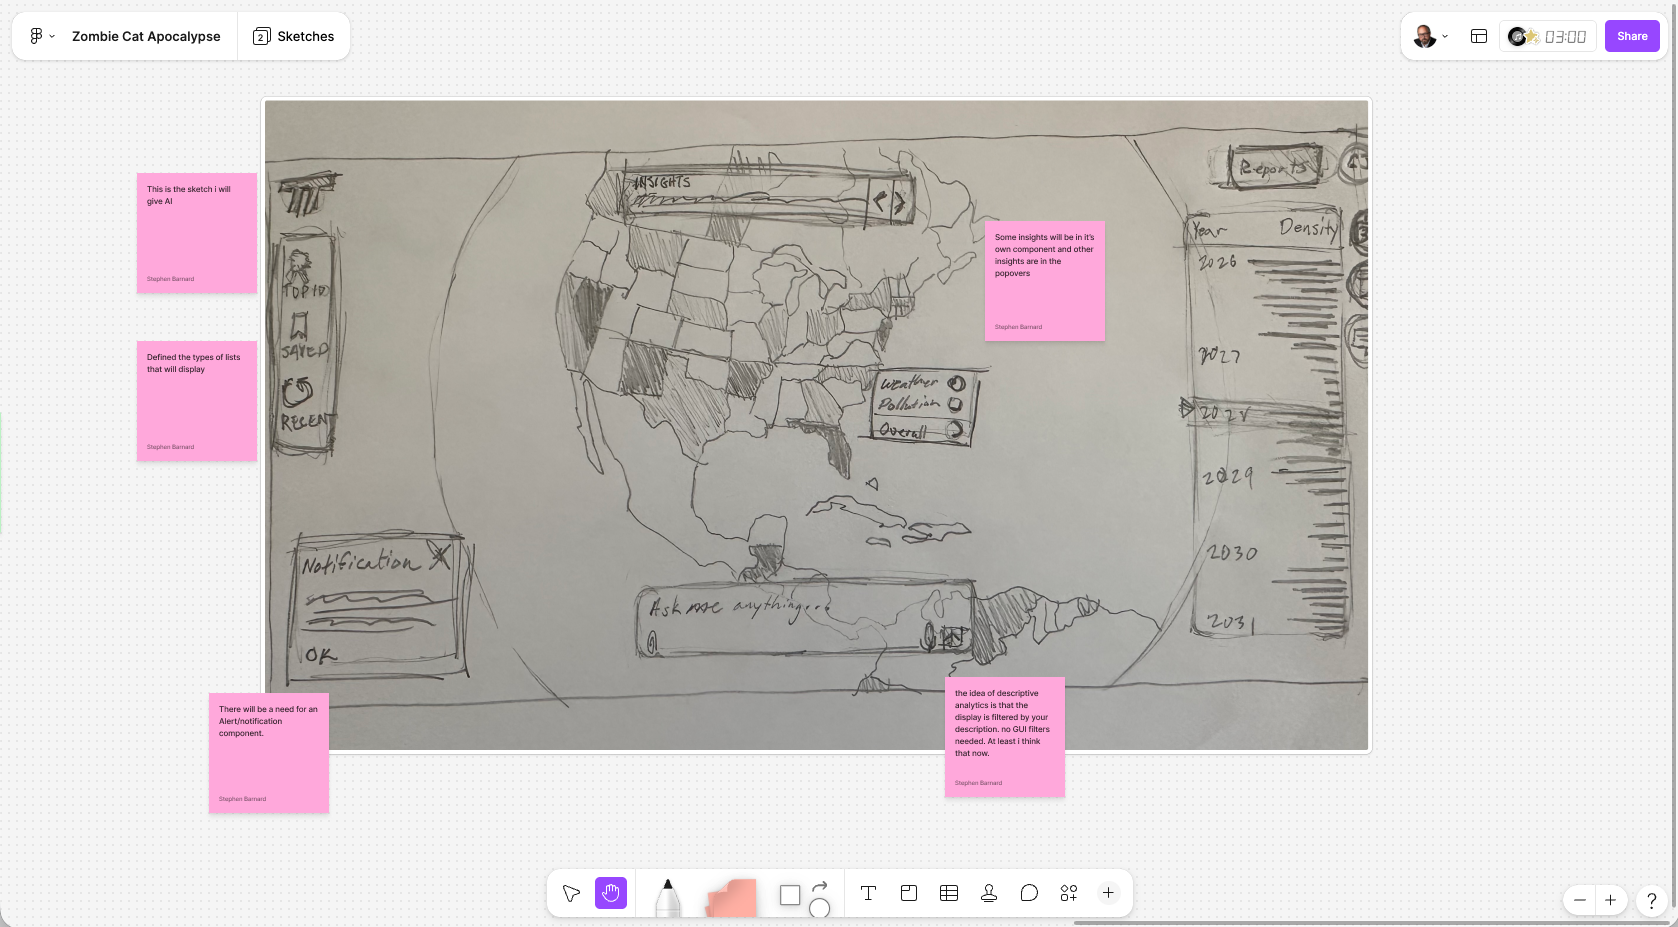
Starting from a rough pencil sketch and reference images produced a much stronger first prototype than starting from a blank prompt. The visual constraints gave Figma Make better direction.
Prompt → Interface
Showed how a single well-structured prompt plus visual references can produce a usable interactive dashboard in one pass.
Map + Time
Treating location and time as equal primary controls made future/past queries feel concrete instead of abstract.
Tone as a Design Tool
A light fictional scenario made rapid exploration easier and still surfaced real interaction problems.
Input as Interface
The natural-language field became the main way to drive the dashboard, reducing the need for traditional filters and menus.
Project Overview
Role
Sole designer – concept through interactive prototype
Scope
End-to-end design exercise: pencil sketch, prompt engineering, Figma Make prototype, and interaction refinement for a natural-language descriptive analytics dashboard